
Checking In On The Fairfield Inn
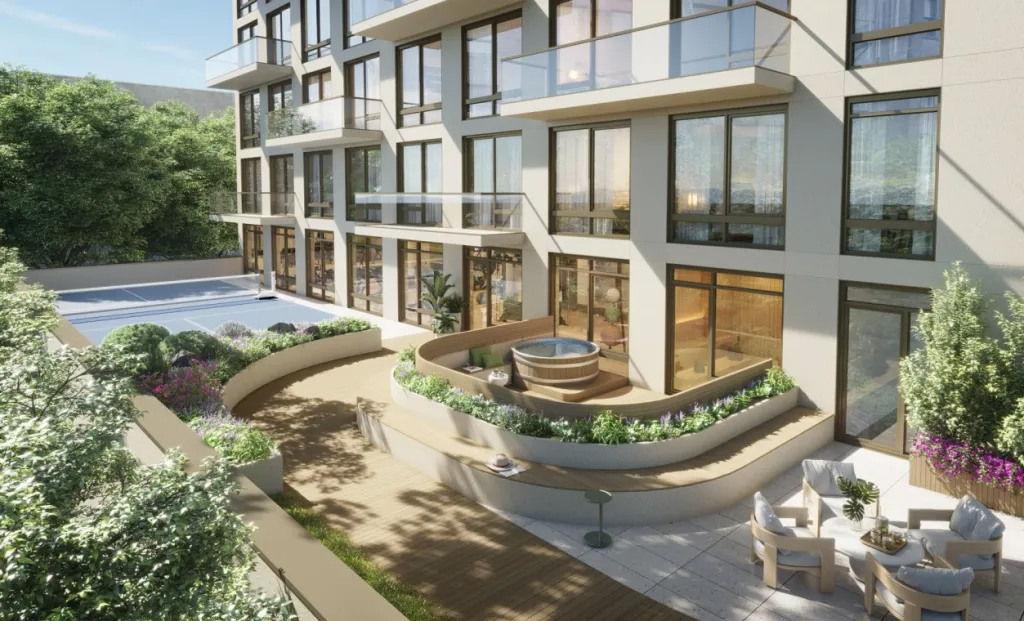
We chronicled the development of the Fairfield Inn on Third Avenue all summer, and then things got pretty quiet. But the construction continues: we just snapped this photo of the entryway and the soon-to-be parking lot. (Here’s a rendering, in case you were curious.) The opening date has been pushed back to January of next…

We chronicled the development of the Fairfield Inn on Third Avenue all summer, and then things got pretty quiet. But the construction continues: we just snapped this photo of the entryway and the soon-to-be parking lot. (Here’s a rendering, in case you were curious.) The opening date has been pushed back to January of next year.
Finally a Rendering of the Fairfield Inn [Brownstoner]
Fairfield Inn Shows Some Skin [Brownstoner]
Fairfield Inn Still Coming Soonish [Brownstoner] GMAP
Sorry Pete – I disagree, in every precinct overall crime statistics are pretty closely correlated to Homicide rates….look for yourself
Additionally Homicide Statistics are the most accurate of all crime statistics because they are not subject to manipulation by the NYPD Brass.
Finally I did not say that the area in question had “high crime” in relation to NYC, what I said in response to NYGuy7’s post – is that although he never had a problem re: the projects- the vast majority of homicide victims in the neighborhood DID – since 75% of them (12 out of 16 since ’03 )happened in or around said projects.
homicide stats not a good indicator of risk of crime for area resident.
since homicides are usually by party known to victim.
76th precinct has larger project than Wyckoff.
And both have pretty low crime rates when compared to rest of NYC.
Crime stats for 84th precinct (Boerum Hill ara) and 76th Precint (Carroll Gardens area). Stats shows that these areas are pretty safe, particularly compared to 20 years ago. I lived in Carroll Gardens for 10 years and in Boerum Hill for 7. The common perception is that Boerum Hill is less safe than Caroll Gardens. I always felt that way, but think both are in the very safe category. Stats show more murders in Carrroll Gardens for the reported years, but lower total crimes. I don’t know how different the precints are in terms of population.
Murders 84th 76th
1990 18 13
1995 9 12
1998 1 7
2001 3 4
2009 1 5
YTD 2020 3 2
Total
Crimes 84th 76th
1990 6,535 2,719
1995 3,214 1,368
1998 2,156 1,018
2001 1,684 732
2009 993 558
YTD 2020 855 514
“Never had a problem with projects in the 9 years I lived near there.”
Bully for you but considering that 75% of all the homicides that have taken place in Boreum Hill in the last 7 years have taken place in or within the immediate vicinity of the projects sort of indicates your little anecdote isnt universal.
looks WAY better than the other inns like Express that are in the area
Not incredibly scenic, but this areas is a pretty up and coming. Brooklyn Boulders is just a few blocks up and bars + restaurants are popping up on 4th ave.
Actually the walk from the Pacific Street entrance at Atlantic Terminal is probably 5-7 minutes. Walking that part of 4th Avenue at night is totally fine….I do it all the time. There’s always people out.
I called to book a room for some family at the Holiday Inn and it was sold out. Second time I’ve tried. The place is regularly quite full, so I’m looking forward to having another option for friends and family who want to stay in the area and not pay $300 a night.
Doesn’t seem to have hurt the other hotels in the area.
biggest minus for this hotel as opposed to several of other in area is longer walk to subway. And since area pretty dead at night and not real pretty, don’t think guests will be so comfortable with that.